Overview
Being able to view and analyse your logs is important, and when running a complex system like kubernetes, hosting many disparate and varied microservices, it’s usually necessary to transport those logs into a separate logging platform, where they can be indexed, secured, displayed and shared appropriately.
Obviously there are many good tools for this, and many people have their own favourites, for a variety of good reasons — Datadog, Dynatrace, Logstash as part of ELK, etc. This post is focussed solely on Splunk, which is the tool of choice for many of Airwalk Reply’s clients, and has served them well for a long time. Here, I’ll outline the process of how we send logs from the containers on a Kubernetes cluster to a Splunk installation, via the Splunk HTTP Event Collector (HEC), using Splunk’s own Splunk Connector for Kubernetes tool, so that log data can be ingested in near real-time, separated for secure access, and displayed in many different ways for analysis.
Splunk-Connect for Kubernetes
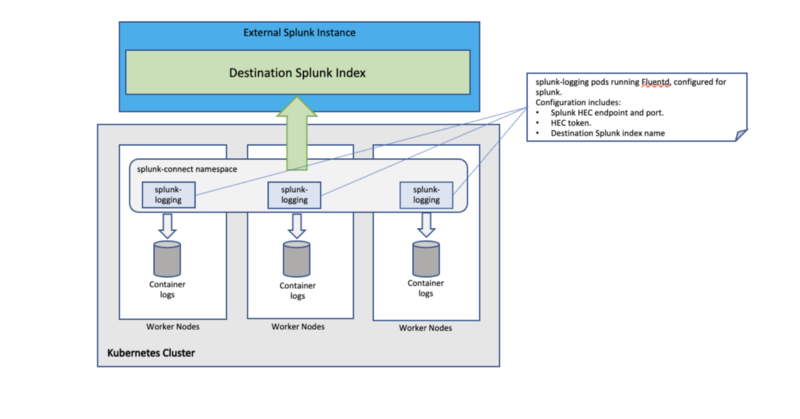
The splunk-connect-for-kubernetes tool is what reads the container log files on each node, and sends the contents to the Splunk instance’s HEC endpoint for indexing. In essence, it is simply Splunk’s own kubernetes-oriented configuration of fluentd, and employs node-level logging architecture in kubernetes terms. It runs as a daemonset on the kubernetes cluster, and is deployed via a helm chart, which is composed of three subcharts:
- splunk-logging — the logs of containers running on the cluster, whether they are system components (a service mesh, for example) or application logs from the microservices running on the cluster.
- splunk-objects — the logs of kubernetes objects (services, pods, deployments, namespaces etc).
- splunk-metrics — detailed metrics for the splunk objects, which are configurable, but typically entail CPU and memory metrics.
For the purposes of this proof-of-concept, I will disable the splunk-objects, and splunk-metrics resources, and use only the splunk-logging chart, so as to ship only the container logs from all pods running on the cluster.
Prerequisites
(NOTE: For simplicity, and to protect our data, I’ve used dummy values for this demo.)
- I have a running Kubernetes cluster, with an application deployed, which is generating log traffic. I can access this cluster using kubectl and run commands to create the necessary resources.
Logs from my application are sent to stdout, and stored on the cluster nodes in /var/log/containers. The cluster is able to pull images from the docker.io registry.
- I already have a running Splunk cluster with a search interface where logs can be observed, and a HEC endpoint (hec.splunk-instance.airwalk-reply.com), ready for the Kubernetes cluster to connect to on port 8088. This post doesn’t extend to administration of the Splunk cluster, we’re just addressing the connection from the Kubernetes side.
- On the Splunk cluster, I have an index created, named airwalk-reply-raw where my raw log data will be sent.
- I also have a HEC token (let’s say 0a1b2c3d-0not-aaaa-real-token0a1b2c3), which is a secure credential for accessing the Splunk instance. The token is configured on the Splunk side to have access to write data to my index.
- I have git and helm installed.
Clone the splunk-connect-for-kubernetes git repository
> git clone https://github.com/splunk/splunk-connect-for-kubernetes.git
Cloning into 'splunk-connect-for-kubernetes'...
remote: Enumerating objects: 2960, done.
remote: Counting objects: 100% (284/284), done.
remote: Compressing objects: 100% (134/134), done.
remote: Total 2960 (delta 167), reused 242 (delta 147), pack-reused 2676
Receiving objects: 100% (2960/2960), 994.34 KiB | 6.67 MiB/s, done.
Resolving deltas: 100% (2087/2087), done.

> cd splunk-connect-for-kubernetes/helm-chart/splunk-connect-for-kubernetes
Configure values.yaml
This values.yaml file is the global one, which plugs values into all three charts. If needed, it’s possible to configure each chart individually using the values.yaml file in each respective chart’s directory.
Here in the global values.yaml, I configure the HEC endpoint, port and index name, which the splunk-logging deamonset will connect to.
# Splunk Connect for Kubernetes is a umbraller chart for three charts
# * splunk-kubernetes-logging
# * splunk-kubernetes-objects
# * splunk-kubernetes-metrics

# Use global configurations for shared configurations between sub-charts.
# Supported global configurations:
# Values defined here are the default values.
global:
  logLevel: info
  splunk:
    hec:
      # host is required and should be provided by user
      host: hec.splunk-instance.airwalk-reply.com
      # port to HEC, optional, default 8088
      port:
      # token is required and should be provided by user
      token:
      # protocol has two options: "http" and "https", default is "https"
      protocol:
      # indexName tells which index to use, this is optional. If it's not present, will use "main".
      indexName: airwalk-reply-raw
Note that I haven’t explicitly set the port number here, as it defaults to port 8088 anyway. Note also that I haven’t added my HEC token. If we’re going to store this values.yaml file, we don’t necessarily want to expose our token here. Instead, I’ll specify it on the command-line when I deploy the daemonset. When automating this whole deployment, the HEC token should be injected as a variable in some secure way. In a recent implementation, we stored it in AWS Secrets Manager, and retrieved it at the time of deployment to be injected in as an environment variable.
Since I’m only going to run the splunk-logging daemonset, I’ll disable splunk-objects and splunk-metrics in their respective sections of the global values.yaml.
## Enabling splunk-kubernetes-objects will install the `splunk-kubernetes-objects` chart to a kubernetes
## cluster to collect kubernetes objects in the cluster to a Splunk indexer/indexer cluster.
splunk-kubernetes-objects:
  enabled: false
## Enabling splunk-kubernetes-metrics will install the `splunk-kubernetes-metrics` chart to a kubernetes
## cluster to collect metrics of the cluster to a Splunk indexer/indexer cluster.
splunk-kubernetes-metrics:
 enabled: false
Run Helm commands to deploy the splunk-logging resources
Executing the necessary helm commands will deploy the kubernetes resources from the splunk-logging helm chart, which are as follows
- A service account, under which the daemonset will run.
- A cluster-role, which has the necessary permissions for the daemonset.
- A cluster-role-binding, which assigns the cluster-role to the service account.
- A configmap, which contains the fluentd config, conveniently tuned by the people at Splunk for our consumption.
- A secret, which holds the value of the HEC token, which will be used to authenticate with the Splunk instance.
- A daemonset, which will run Splunk’s own fluentd image, which will be pulled from docker.io.
So here we go …
> pwd
/Users/tomsalisbury/repos/splunk-connect-for-kubernetes/helm-chart/splunk-connect-for-kubernetes
>
> kubectl create namespace splunk-connect

> helm install splunk-connect-for-kubernetes . -f values.yaml --set global.splunk.hec.token=0a1b2c3d-0not-aaaa-real-token0a1b2c3 --set splunk-kubernetes-logging.fullnameOverride=splunk-logging
So with that, I now have all my resources running on the kubernetes cluster.
> kubectl -n splunk-connect get service-accounts
NAME             SECRETS     AGE
splunk-logging   1           34s

> kubectl -n splunk-connect get clusterrole splunk-logging
NAME             CREATED AT
splunk-logging   2021-06-26T16:24:29Z

> kubectl -n splunk-connect get pods
NAME                     READY      STATUS   RESTARTS   AGE
splunk-logging-4fmhq     1/1        Running  0          1m
splunk-logging-5frhj     1/1        Running  0          2m
splunk-logging-6258m     1/1        Running  0          46s
splunk-logging-7bcdz     1/1        Running  0          2m
splunk-logging-cwkh2     1/1        Running  0          1m
splunk-logging-fflb2     1/1        Running  0          1m
I can check the logs of the pods to see that they are running ok
kubectl -n splunk-connect logs -f splunk-logging-4fmhq
I can view the splunk-logging configmap to see my running configuration of fluentd
kubectl -n splunk-connect get configmap splunk-logging -o yaml
And finally, I can log into my Splunk user interface, and confirm that logs are being successfully ingested, and are searchable, with the query index=airwalk-reply-raw.
Time to sit back, relax, and watch those lovely logs come in!
To Conclude …
There are many useful tools for shipping container logs to the various logging systems out there, and splunk-connect-for-kubernetes is one of the good ones.
It’s easy to deploy and takes away the considerable pain of having to construct your own configuration of fluentd. This post has illustrated how we at Airwalk Reply have scheduled the tool in Kubernetes, and are using it to reliably and securely send logs to an external instance of Splunk.
There is also much more in the box, with many tweaks readily available to be made. It’s still possible to explore the benefits of deploying the splunk-kubernetes-objects and splunk-kubernetes-metrics helm charts, and many additional challenges and problems can be solved creating custom filters and metadata in the values.yaml , so watch this space for more posts on that in future.
Airwalk Reply offers Kubernetes consulting services, contact us for more information.