Site reliability engineering is an increasingly popular concern on any platform running critical systems, and one of the tools it requires has to provide comprehensive monitoring and alerting capabilities.
On the other hand, Kubernetes (K8s) is often considered a de-facto candidate to build such a platform because of its rich features regarding workload management. However, regarding its complexity, having proper monitoring on K8s is a challenging story.
Fortunately, some monitoring software providers have provided integration with K8s. Datadog is one of those vendors and it provides features like dashboards, API access and integration with numerous third party providers like cloud providers and software.
In this article, I will demonstrate how we can integrate Datadog monitoring on Amazon EKS, one of popular K8s service providers with the following tasks:
- Create an AWS VPC and an EKS cluster with 2 nodes
- Enable Datadog integration with AWS
- Enable Datadog integration with EKS clusters
Prerequisite
We assume the readers are familiar with the following technologies:
- AWS, EKS
- Terraform (v1.0+)
- Helm (v3)
Create an AWS VPC and an EKS cluster with 2 nodes
Most of the below code snippet in this section is credited to Provisioning Kubernetes clusters on AWS with Terraform and EKS.
The below code snippet makes use of terraform-aws-modules and creates a VPC with one public and one private subnet. It also tags the subnets so that the cluster is able to create K8s nodes there.
data "aws_availability_zones" "available" {
}
locals {
  cluster_name = "test-eks"
}
module "vpc" {
  source  = "terraform-aws-modules/vpc/aws"
  version = "~> 2.47"
name                 = "test-vpc"
  cidr                 = "172.16.0.0/16"
  azs                  = data.aws_availability_zones.available.names
  private_subnets      = ["172.16.1.0/24", "172.16.2.0/24", "172.16.3.0/24"]
  public_subnets       = ["172.16.4.0/24", "172.16.5.0/24", "172.16.6.0/24"]
  enable_nat_gateway   = true
  single_nat_gateway   = true
  enable_dns_hostnames = true
public_subnet_tags = {
    "kubernetes.io/cluster/${local.cluster_name}" = "shared"
    "kubernetes.io/role/elb"                      = "1"
  }
private_subnet_tags = {
    "kubernetes.io/cluster/${local.cluster_name}" = "shared"
    "kubernetes.io/role/internal-elb"             = "1"
  }
}
After the VPC is created, the below code snippet creates an EKS cluster, which runs in the new VPC, with a node group of maximum size of 2. The module also refers to a local json file of IAM policy where you can copy the source from iam-policy.json.
module "eks" {
  source          = "terraform-aws-modules/eks/aws"
cluster_version = "1.21"
  cluster_name    = local.cluster_name
  vpc_id          = module.vpc.vpc_id
  subnets         = module.vpc.private_subnets
  enable_irsa     = true
  tags = {
    Environment = "test"
    GithubRepo  = "terraform-aws-eks"
    GithubOrg   = "terraform-aws-modules"
  }
  node_groups = {
    example = {
      desired_capacity = 1
      max_capacity     = 2
      min_capacity     = 1
instance_types = ["t3.medium"]
k8s_labels = {
        Environment = "test"
        GithubRepo  = "terraform-aws-eks"
        GithubOrg   = "terraform-aws-modules"
      }
      additional_tags = {
        ExtraTag = "example"
      }
      taints = [
      ]
      update_config = {
        max_unavailable_percentage = 50 # or set `max_unavailable`
      }
    }
  }
  workers_additional_policies = [aws_iam_policy.worker_policy.arn]
}
resource "aws_iam_policy" "worker_policy" {
  name        = "worker-policy"
  description = "Worker policy for the ALB Ingress"
  policy = file("iam-policy.json")
}
Enable Datadog integration with AWS
After an EKS cluster is created, we start enabling Datadog integration with AWS. Before that we need Datadog to recognise our AWS account, so we add the Datadog api and application keys to the AWS Systems Manager Parameter Store and create a data source reference.
data "aws_ssm_parameter" "datadog_api_key" {
    name = "/datadog-demo/datadog/apikey"
}
data "aws_ssm_parameter" "datadog_app_key" {
    name = "/datadog-demo/datadog/appkey"
}
Then we create mandatory resources for the integration:
provider "datadog" {
  api_key = data.aws_ssm_parameter.datadog_api_key.value
  app_key = data.aws_ssm_parameter.datadog_app_key.value
  validate = false
}
resource "datadog_integration_aws" "sandbox" {
  account_id  = var.account_id
  role_name   = "DatadogAWSIntegrationRole"
  account_specific_namespace_rules = {
    auto_scaling = false
    opsworks     = false
  }
  excluded_regions = ["us-east-1", "us-west-2"]
}
We also need to create a role which does all things on behalf of Datadog AWS account 464622532012:
data "aws_iam_policy_document" "datadog_aws_integration_assume_role" {
  statement {
    actions = ["sts:AssumeRole"]
principals {
      type = "AWS"
      identifiers = ["arn:aws:iam::464622532012:root"]
    }
    condition {
      test = "StringEquals"
      variable = "sts:ExternalId"
values = [
        datadog_integration_aws.sandbox.external_id
      ]
    }
  }
}
resource "aws_iam_role" "datadog_aws_integration" {
  name = "DatadogAWSIntegrationRole"
  description = "Role for Datadog AWS Integration"
  assume_role_policy = "${data.aws_iam_policy_document.datadog_aws_integration_assume_role.json}"
}
resource "aws_iam_role_policy_attachment" "dd_AmazonEC2ReadOnlyAccess" {
  role = "${aws_iam_role.datadog_aws_integration.name}"
  policy_arn = "arn:aws:iam::aws:policy/AmazonEC2ReadOnlyAccess"
}
resource "aws_iam_role_policy_attachment" "dd_AmazonSQSReadOnlyAccess" {
  role = "${aws_iam_role.datadog_aws_integration.name}"
  policy_arn = "arn:aws:iam::aws:policy/AmazonSQSReadOnlyAccess"
}
resource "aws_iam_role_policy_attachment" "dd_CloudWatchReadOnlyAccess" {
  role = "${aws_iam_role.datadog_aws_integration.name}"
  policy_arn = "arn:aws:iam::aws:policy/CloudWatchReadOnlyAccess"
}
data "aws_iam_policy_document" "datadog_policy" {
  statement {
    sid = "datadogpolicy"
    actions = [
      "tag:GetResources"
    ]
    resources = [
      "*",
    ]
  }
}
resource "aws_iam_role_policy" "datadog_policy" {
  name = "datadog_policy"
  role = "${aws_iam_role.datadog_aws_integration.name}"
  policy = data.aws_iam_policy_document.datadog_policy.json
}
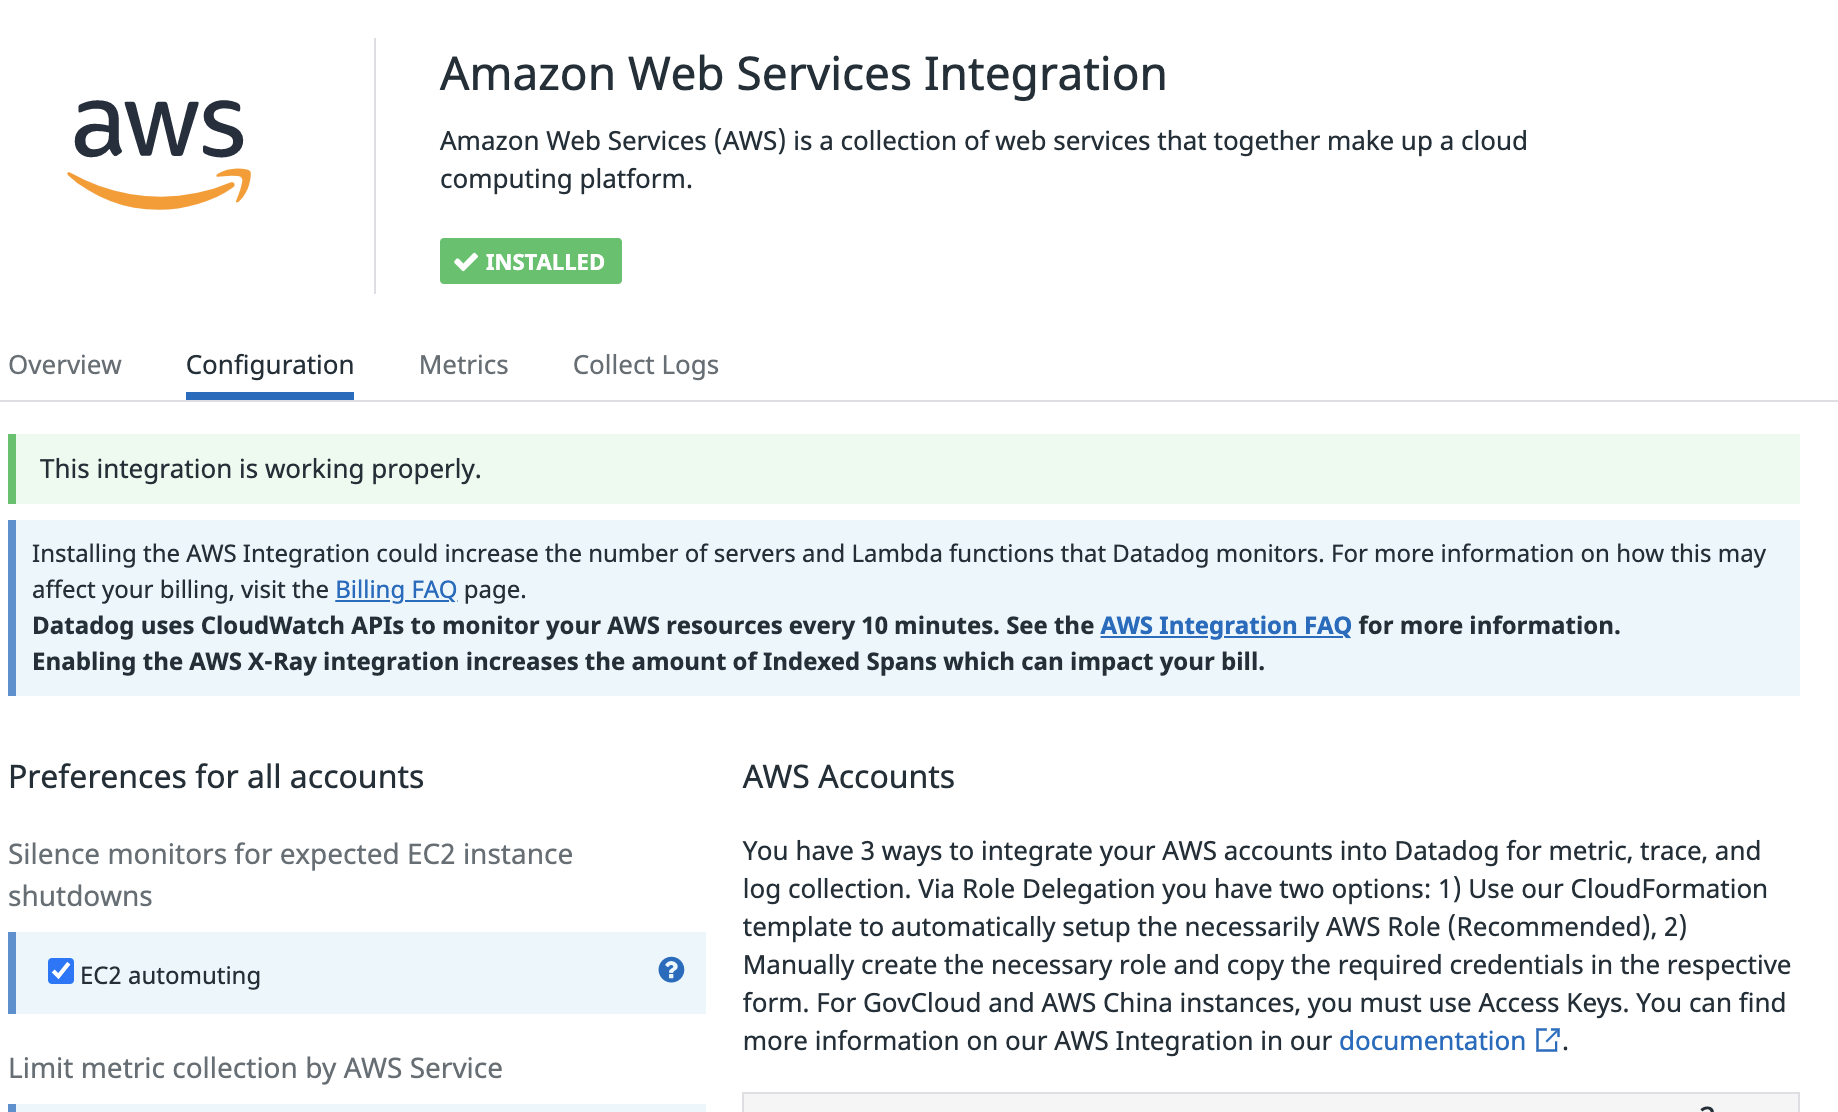
After the above terraform module applies successfully, we should see the successful integration page from https://app.datadoghq.com/account/settings#integrations/amazon-web-services
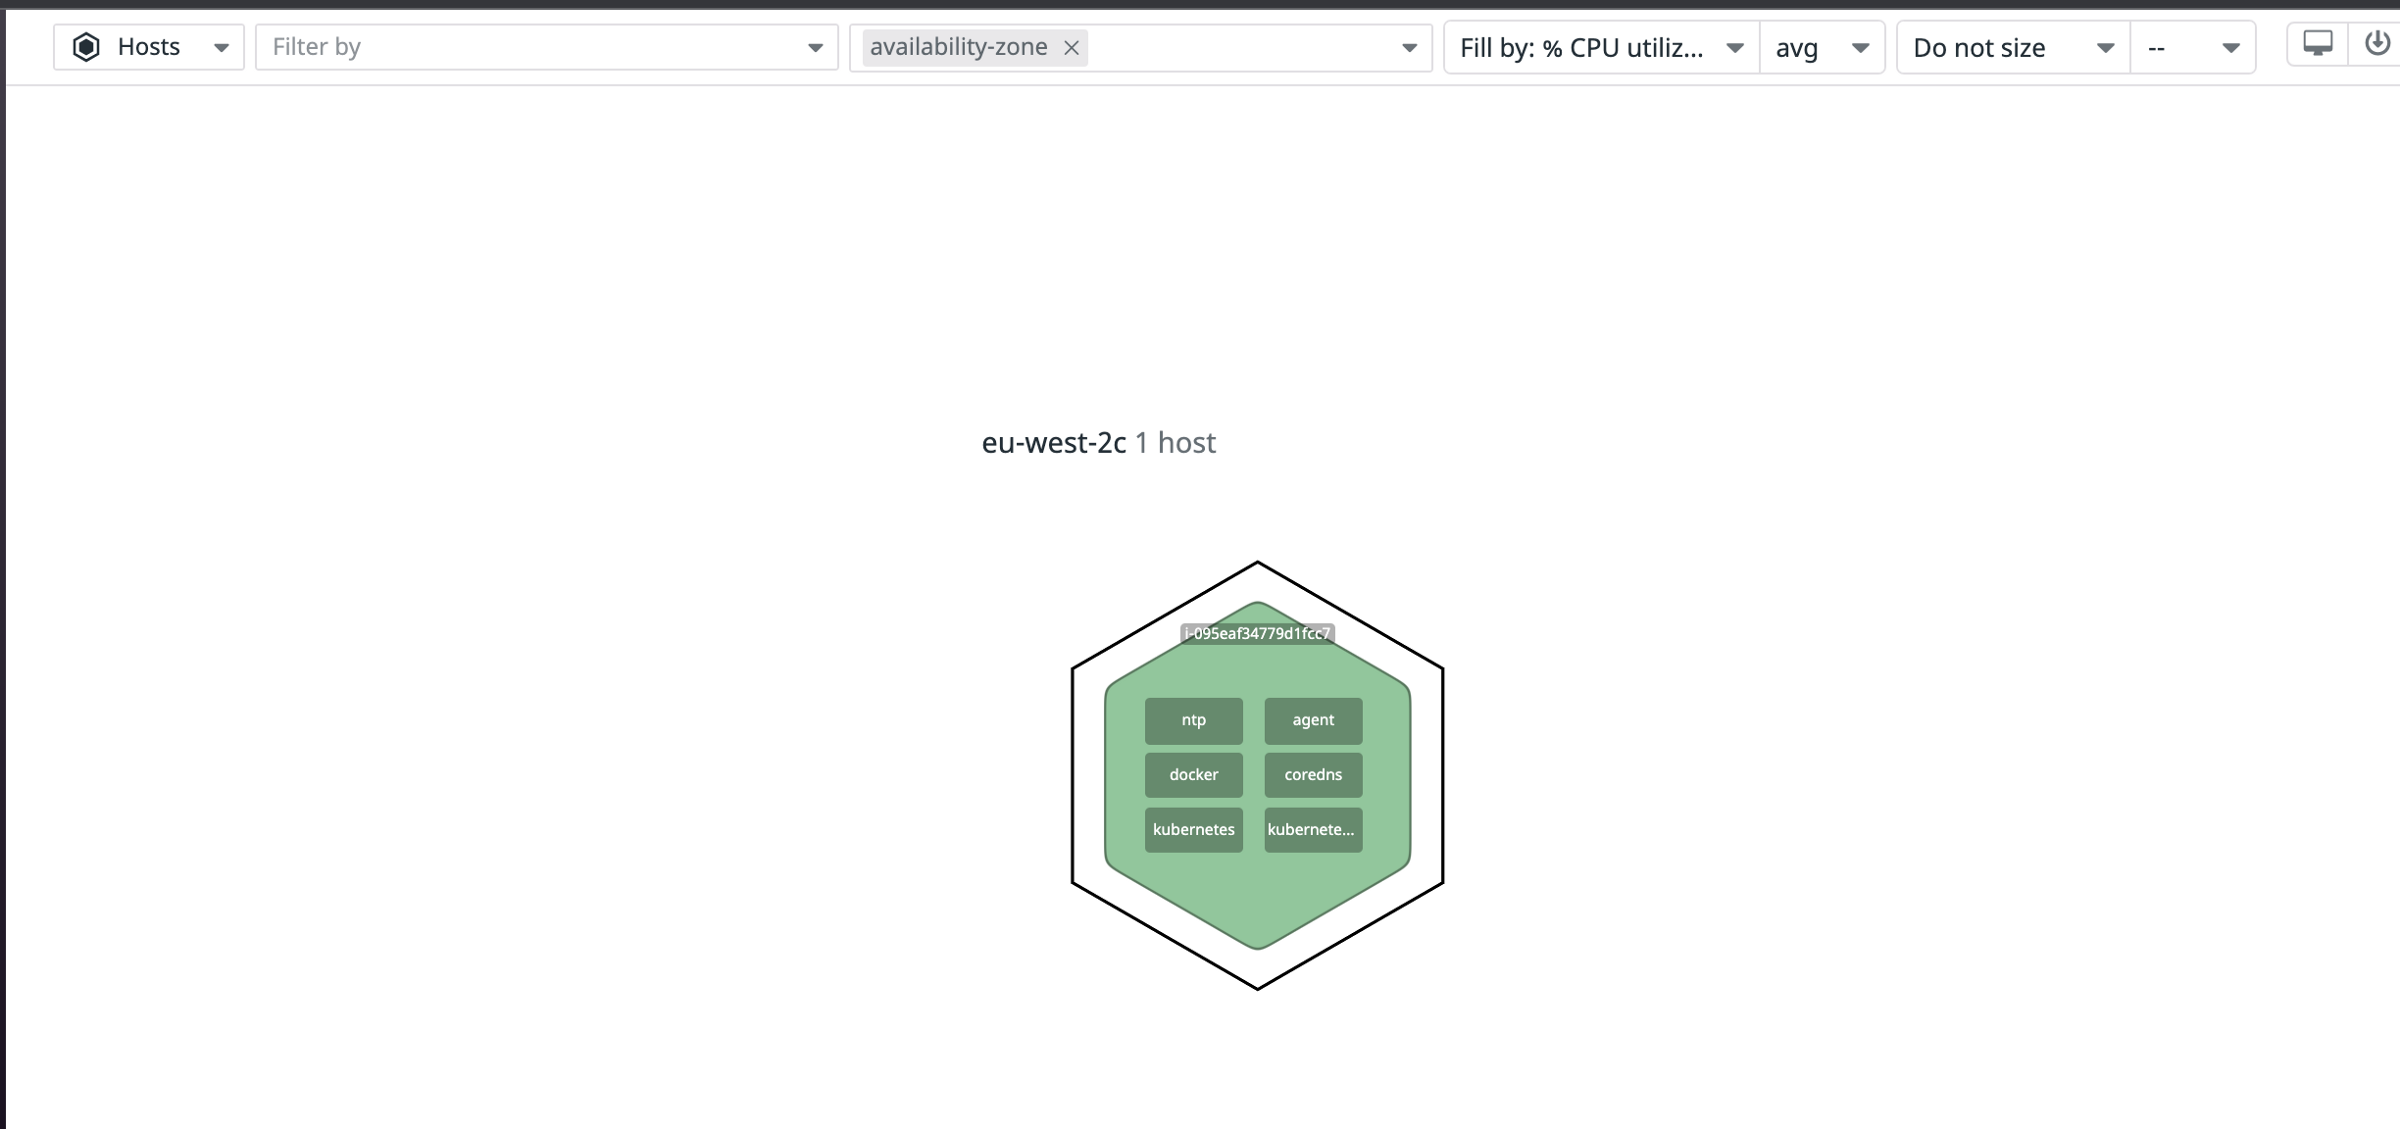
We can do a simple check on host map from infrastructure in the Datadog console and it should show the status of a single host instance running in AWS:
Enable Datadog integration with EKS clusters
The next thing we will do is the integration with the EKS cluster. The below Terraform code makes use of a Helm provider. It downloads and installs the required Helm chart from the Datadog repository to our cluster with the api key we defined above.
provider "helm" {
  kubernetes {
    host                   = data.aws_eks_cluster.eks.endpoint
    cluster_ca_certificate = base64decode(data.aws_eks_cluster.eks.certificate_authority.0.data)
    exec {
      api_version = "client.authentication.k8s.io/v1alpha1"
      args        = ["eks", "get-token", "--cluster-name", local.cluster_name]
      command     = "aws"
    }
  }
}
resource "helm_release" "datadog" {
  namespace = "datadog"
  name       = "datadog"
  chart      = "datadog"
  repository = "https://helm.datadoghq.com"

  set {
    name  = "datadog.apiKey"
    value = data.aws_ssm_parameter.datadog_api_key.value
  }
create_namespace = true
}
Once the installation ran successfully, we should see the new resources running in namespace datadog:
kubectl get all -n datadog
NAME                                              READY   STATUS    RESTARTS   AGE
pod/datadog-cluster-agent-6fc87f6c4-jx6nk         1/1     Running   0          3d1h
pod/datadog-kube-state-metrics-6fb56bf889-kfd79   1/1     Running   0          3d1h
pod/datadog-wxrgb                                 3/3     Running   0          3d1h
NAME                                 TYPE        CLUSTER-IP       EXTERNAL-IP   PORT(S)    AGE
service/datadog-cluster-agent        ClusterIP   10.100.91.56             5005/TCP   3d1h
service/datadog-kube-state-metrics   ClusterIP   10.100.166.254           8080/TCP   3d1h
NAME                     DESIRED   CURRENT   READY   UP-TO-DATE   AVAILABLE   NODE SELECTOR            AGE
daemonset.apps/datadog   1         1         1       1            1           kubernetes.io/os=linux   3d1h
NAME                                         READY   UP-TO-DATE   AVAILABLE   AGE
deployment.apps/datadog-cluster-agent        1/1     1            1           3d1h
deployment.apps/datadog-kube-state-metrics   1/1     1            1           3d1h
NAME                                                    DESIRED   CURRENT   READY   AGE
replicaset.apps/datadog-cluster-agent-6fc87f6c4         1         1         1       3d1h
replicaset.apps/datadog-kube-state-metrics-6fb56bf889   1         1         1       3d1h
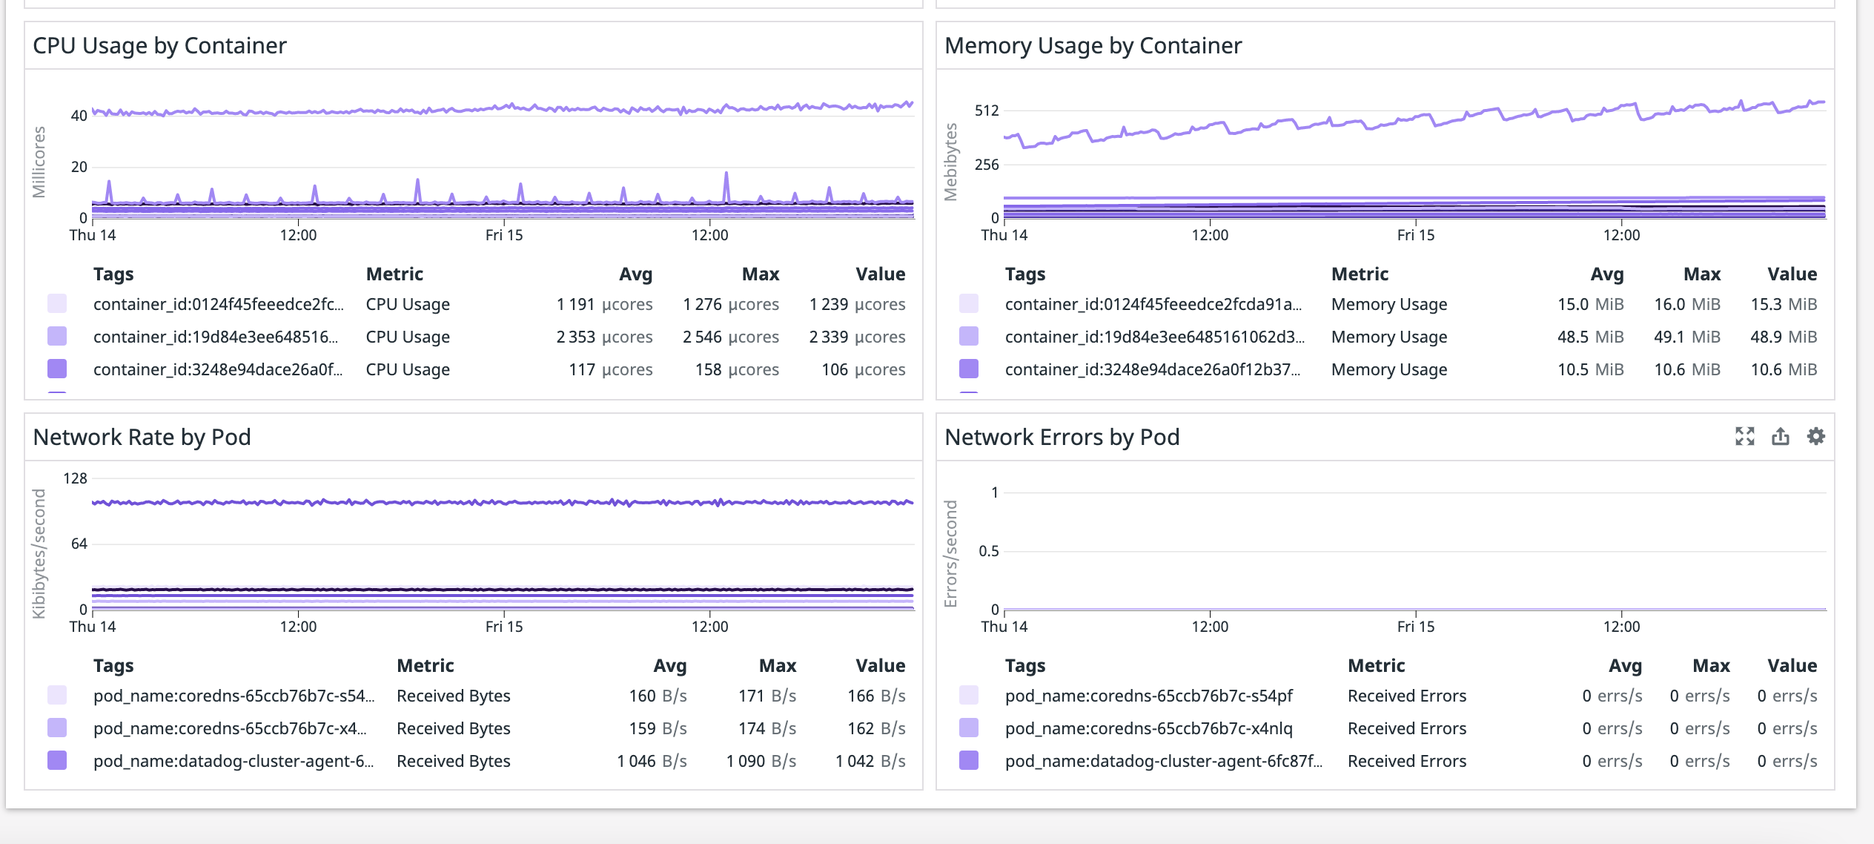
The integration should be completed and we can verify it from the Datadog console. We go to one of Datadog built-in dashboards: Kubernetes Pods Overview and should see something similar to the below screenshot:
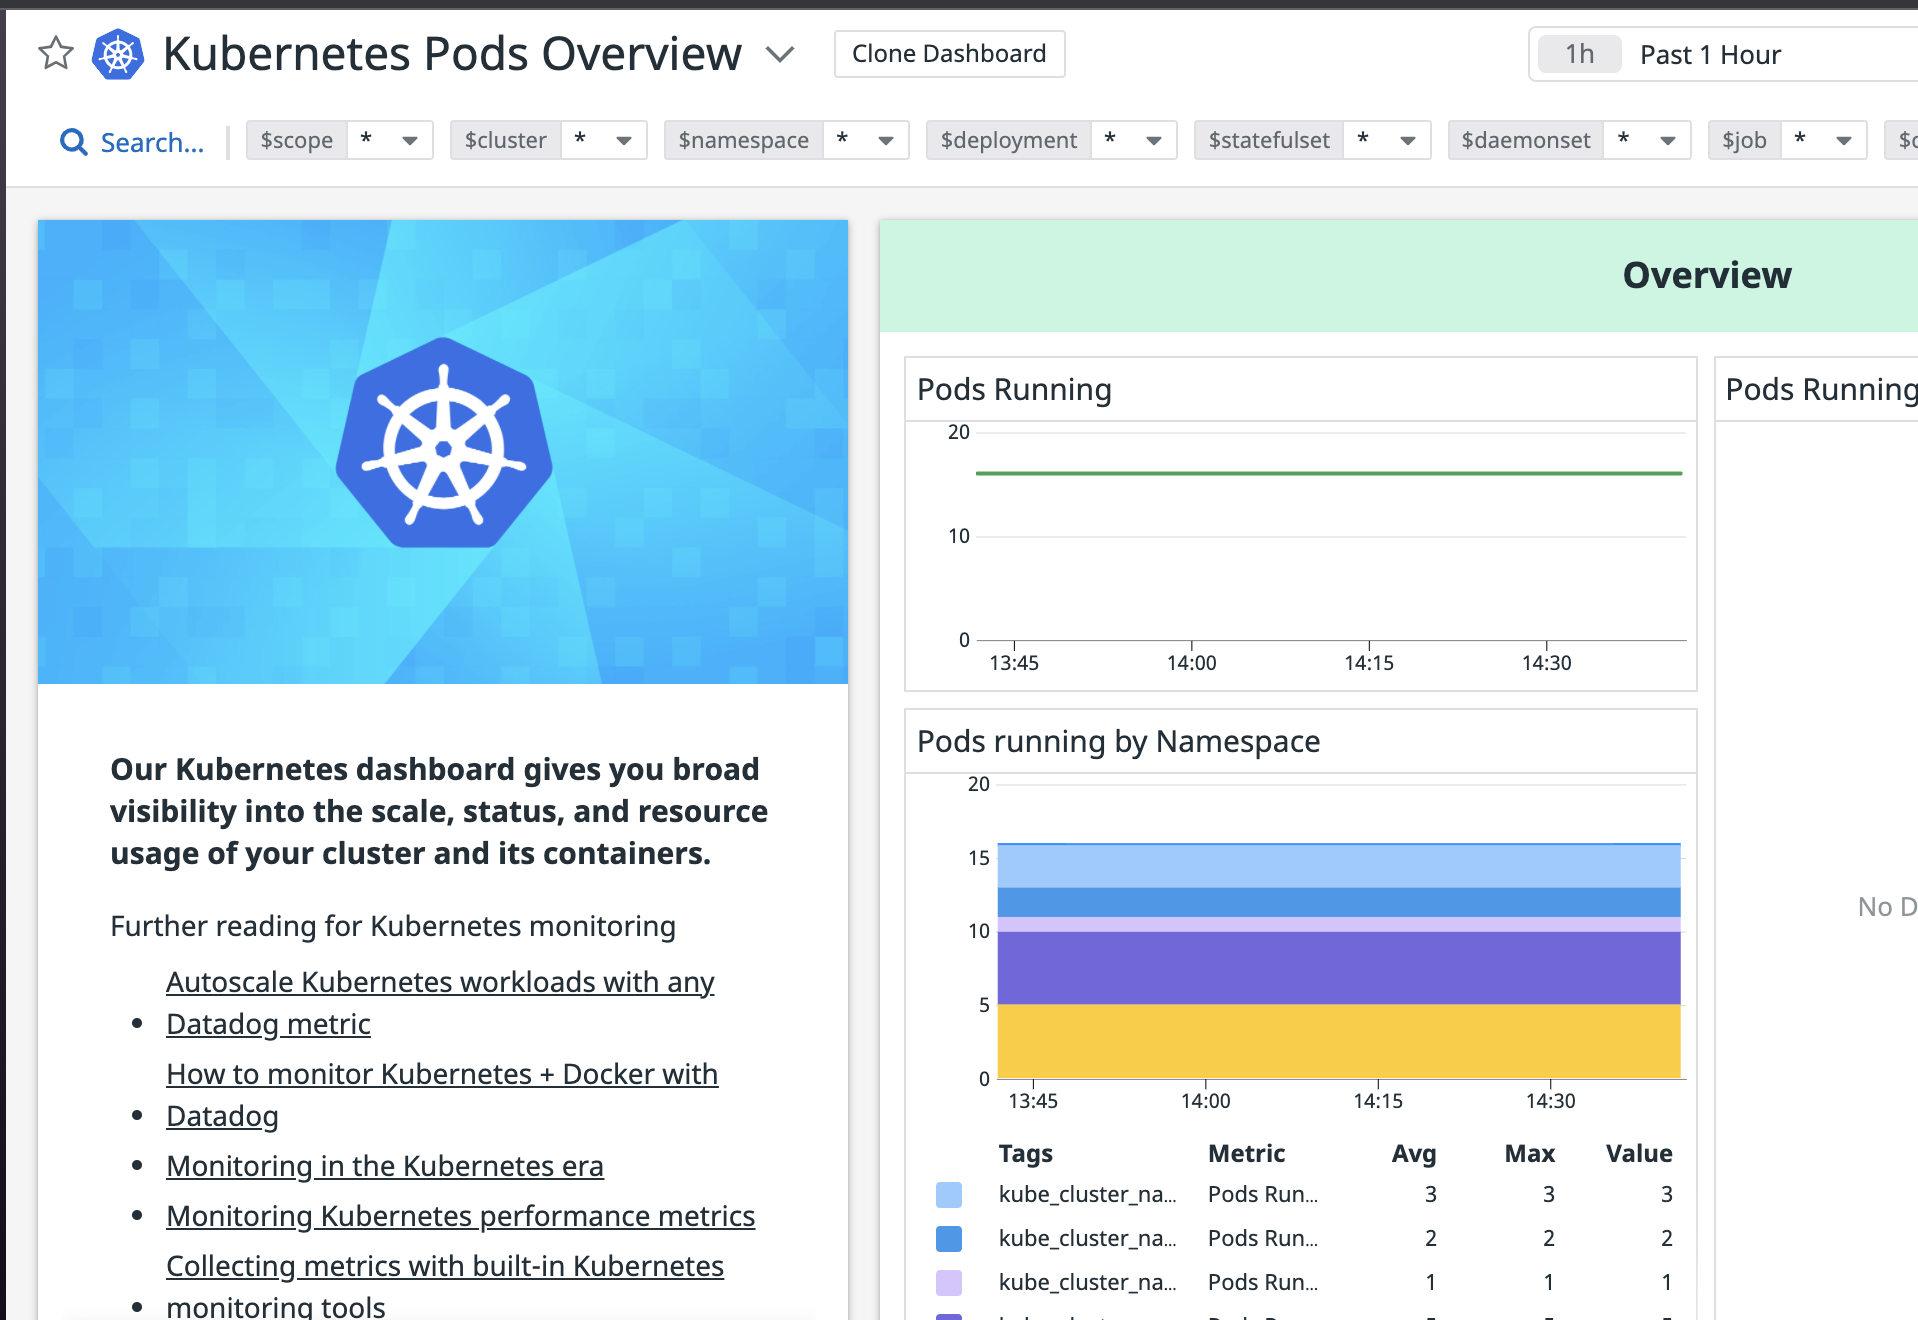
The above screenshot shows that the datadog agent is able to retrieve the pod metrics and send them to the Datadog server successfully.
It goes without saying that you can now create more alerts and dashboards to monitor your EKS clusters and help your SRE journey!
Contact Us if you’d like to discuss this article further or if you want to know more about our Engineering offering, or our Kubernetes consulting services.