Amazon Managed Service for Prometheus and Amazon Managed Grafana
Written by Jim Lamb, Head of Engineering at Airwalk Reply
There was a time, before the phrase 'observability' had been coined, that collecting metrics from our services was always an afterthought. Thankfully nowadays when designing platforms for our clients, the cap is barely off the whiteboard pen before we ask ourselves how we’re going to observe the behaviour of the platform.
When it comes to running microservices architectures on containerisation platforms, there are an awful lot of metrics to collect (or if there aren’t you should ask yourself why). If we think about Kubernetes and the sorts of large-scale platforms we’ve been building for our clients at Airwalk Reply, we find that Prometheus, the Open Source monitoring system overseen by the Cloud Native Computing Foundation (CNCF), is the obvious choice.
For a start, all Kubernetes components expose metrics out-of-the-box in Prometheus format. Of course, exposing metrics doesn’t mean they go anywhere, as the model is that metrics are exposed to be collected asynchronously, but it’s a very good start. Understanding what’s going on within the platform itself is crucial when trying to diagnose problems with the applications running on top.
And if you’re going to be using Prometheus to monitor your platform, why not use the same for your applications? Instrumenting your code to expose metrics in Prometheus format is straightforward and there are libraries available for many programming languages.
Once we’ve got our platform and our microservices applications exposing metrics, we need to think about how we collect all this information and where it’s going to go. One of the common problems with Prometheus installations is a lack of planning. It all goes great in the dev environment, but when you get to production the amount of data overwhelms the server and your hand is quickly forced into re-architecting your entire Prometheus setup. You might try to stick a plaster over the problem by downsampling, reducing the cardinality of your data or throwing away older data, but this just reduces your visibility! To avoid any of this, let’s think about it holistically from the start.
To be able to query all your data, you need to do more than just install one Prometheus server per Kubernetes cluster. You need to find a way to be able to correlate data that has come from many clusters, perhaps because your application is deployed into multiple regions or because you want to compare the performance of the latest release to pre-production with the version running in production. You could get into federating Prometheus servers, or sharding data across multiple Prometheus servers, but an easier alternative is to find a managed service that will provide a single, scalable Prometheus server to ingest as much data as you can throw at it.
Amazon Managed Service for Prometheus (AMP) is just such a service. It is based on Open Source Prometheus and utilises another CNCF project: Cortex. Cortex provides a number of things that Prometheus does not – multi-tenancy, authentication, authorization, built-in long-term storage – features that are vital to provide Prometheus “as a service”.
You can use the remote write feature of Prometheus to send metrics from all your clusters, via open source tools such as the Grafana Agent, OpenTelemetry Collector or a local installation of Prometheus itself, to AMP without worrying about whether you are going to run out of space or struggle with the volume of data; AMP will scale up or down as your data volumes require. Pricing is based on metrics ingested, queried and stored so you pay for what you use. But best of all, you don’t have to worry about managing servers, clusters, federation or sharding.
From a security point of view, access is controlled via the same AWS Identity and Access Management (IAM) that we use for everything else in AWS. You can also use VPC endpoints to connect to AMP, meaning your data never leaves your VPC.
For resilience, AMP is automatically deployed across availability zones (AZs) and stores your data on Amazon S3, with its eleven nines durability.
Now you have all your data in one place, you can query it all using a tool like Grafana. Grafana is another Open Source project within the CNCF fold which analyses and visualises data which is stored in other systems. It very commonly used with Prometheus.
AWS have a fully managed offering here as well, namely Amazon Managed Grafana (AMG). Once again, we don’t have to worry about provisioning servers or storage, as this is all automatic. Pricing is based on the number of editors and viewers who you grant access to your Grafana workspace.
AMG uses AWS Signature Version 4 (SigV4) authentication to connect to AMP, ensuring that all connections are appropriately authenticated and authorised using AWS IAM. Further, connections to the Grafana frontend are authenticated via AWS Single Sign-On.
Amazon Managed Grafana doesn’t just allow you to analyse data from AMP, you can also pull in metrics from self-hosted Prometheus or InfluxDB servers, from a range of AWS services including Amazon CloudWatch, AWS X-Ray, AWS IoT SiteWise and Amazon Elasticsearch Service as well as from third-party services such as DataDog and Splunk.
These integrations allow us to monitor much more than just Kubernetes-based workloads; we can gain insights into applications running on or utilising just about any AWS service, including Amazon EC2, Amazon ECS, AWS Fargate and AWS Lambda. We can monitor the health of databases, queues, object storage – the works.
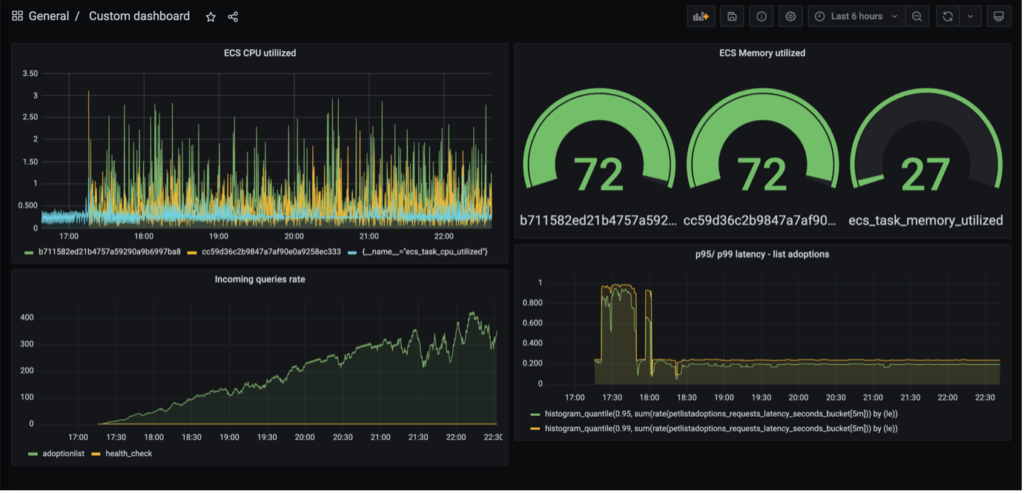
A dashboard in Amazon Managed Grafana
As we’ve seen, we now have some really powerful tools available in the form of Amazon Managed Service for Prometheus and Amazon Managed Grafana which allow us to pull in metrics from our applications, the runtime platforms they run on as well as the infrastructure that sits below. This makes it so much easier to spot performance issues, correlate errors and trace transactions through increasingly complex heterogeneous systems, without having to spend time worrying about scaling or resilience of your observability platform.
Airwalk Reply is proud to be a migration partner for Amazon Managed Service for Prometheus. Please get in touch to find out more.